Free resources for your classrooms
Quizzes, rubrics, blank graphs and guides made by teachers who use Learning That Lasts. Download them, adapt them to your own key concepts, and use them this week.
New to Learning That Lasts? Start here.
Give students the year
In week one, hand out a numbered list of the year’s key concepts, and dichotomous rubrics for the skills students will master by the year’s end. Students picture themselves on the 1-yard line, looking at the goal posts they will reach by the end of the school year.
Quiz a random sample
Seven weeks each quarter, students take a quiz on a random sample of questions from the full-year list. The quiz isn’t graded. Some questions preview what is still to come; others review what students are remembering.
Graph it and celebrate
Students graph their own score, the class adds up its total, and every new best is celebrated.
PowerPoint quizzes
Each slide is one question from a year’s key concepts. Draw a few numbers at random each week, show those slides, and graph the class total. Use them as they are, or as a model for your own.
Social studies
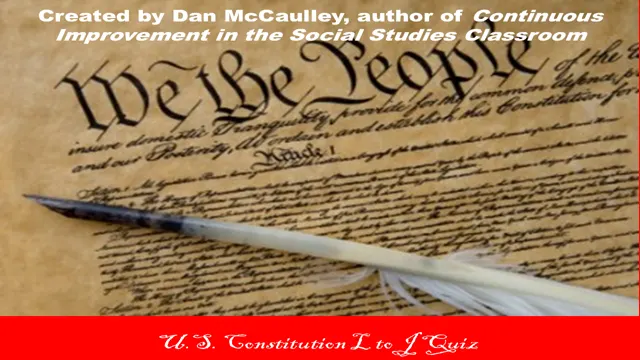
U.S. Constitution
High school social studies. By Dan McCaulley.
Government
High school social studies.
Introduction to law
180 questions, with a hockey theme. By Grant Torpin, Shelton Public Schools.
Business
High school business.
Geography
Grade 5.
Eastern Hemisphere vocabulary
“L to Jedi.” Middle school. By Brad Talley, Alcott Middle School, Norman, Oklahoma.

Science
Biology vocabulary
High school science.
Physics
High school science.
The periodic table
Three questions for every element, 453 slides.


Math
Math
Grade 6.
Geometry
By Jenny Paden.

English language arts
Vocabulary across subjects
Grade 5, 100 questions.
Grammar
By Hannah and Jacob.
Grammar, high school
Literary terms
Arts and physical education
Music vocabulary
Advanced art
Physical education: fitness
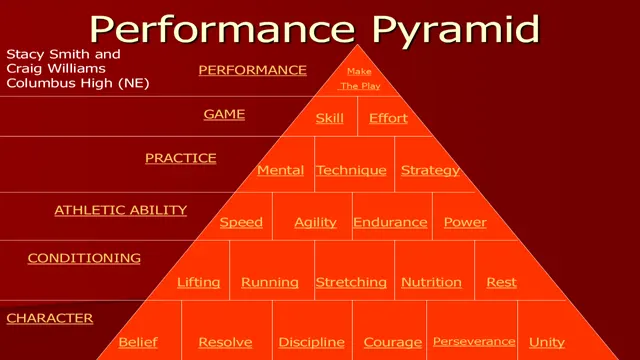
The performance pyramid and aerobic fitness.

Templates to build your own
Numbered slides ready for your own questions. Add one question to each slide.
180 questions
225 questions
64 questions, hockey theme
By Grant Torpin, Shelton Public Schools.
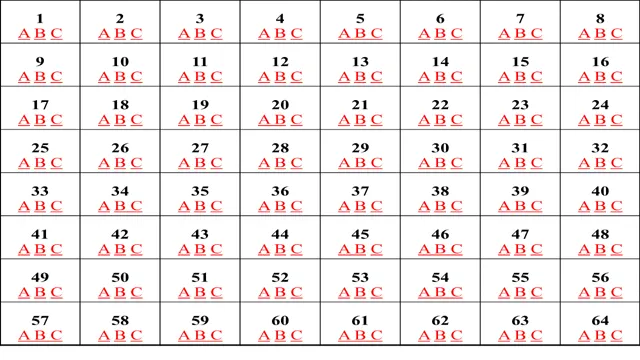
128 multiple-choice (A, B, C) questions
In two files: questions 1–64 and 65–128.

These work best when a whole staff starts together. Book Dr. Jenkins for a workshop.
Dichotomous rubrics
For skills, a dichotomous rubric takes the place of a concept list: every line is a yes-or-no question, so students and teachers agree on the score. Start with a blank one, then borrow from the samples.
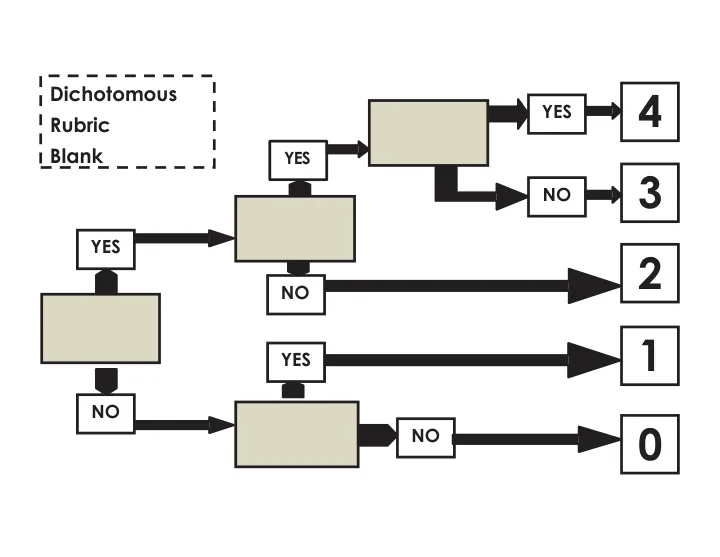
Blank dichotomous rubric, 0 to 4
Write a yes-or-no question in each box; the answers lead to a score from 0 to 4, so a top score of 4 matches the four quarters of the school year.
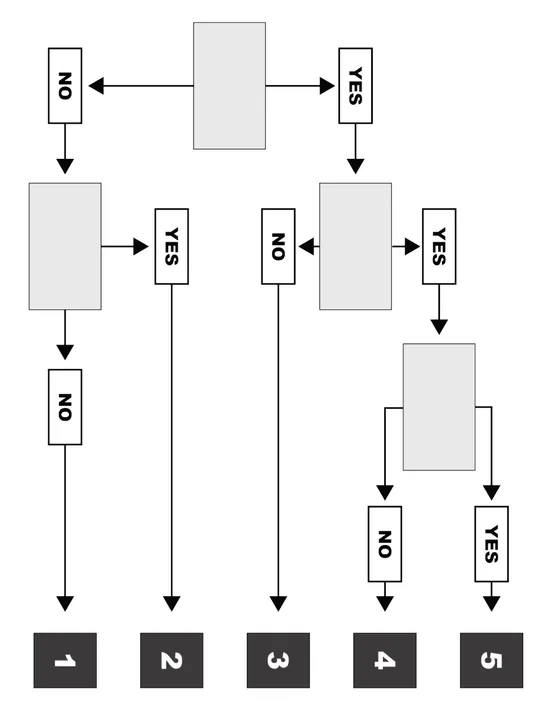
Blank dichotomous rubric, 1 to 5
The same rubric with scores from 1 to 5, for teachers who prefer it.
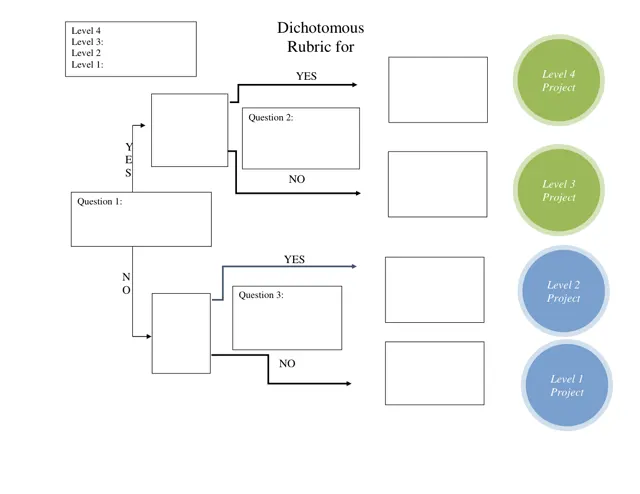
Blank dichotomous rubric, four levels
Three questions leading to levels 1 to 4, ready to fill in for any skill.
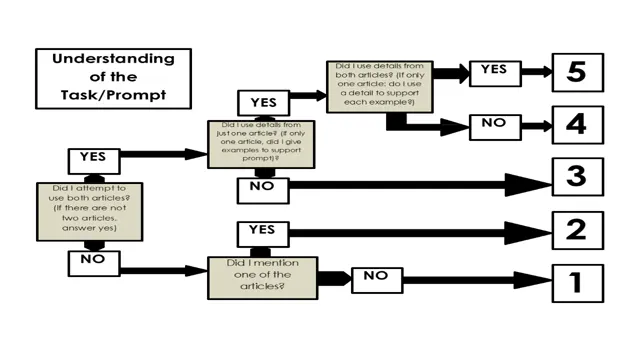
Essay writing, in six rubrics
Task and prompt, focus, organization, development, grammar, and the writer’s purpose.
A collection of sample rubrics
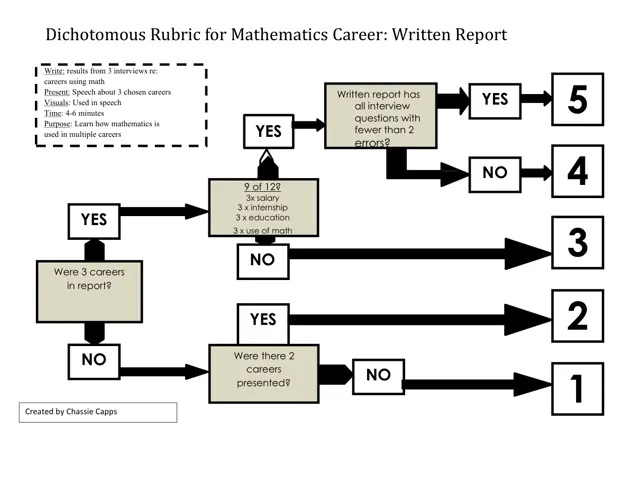
Math careers (by Chassie Capps), reading, grammar and essay organization.
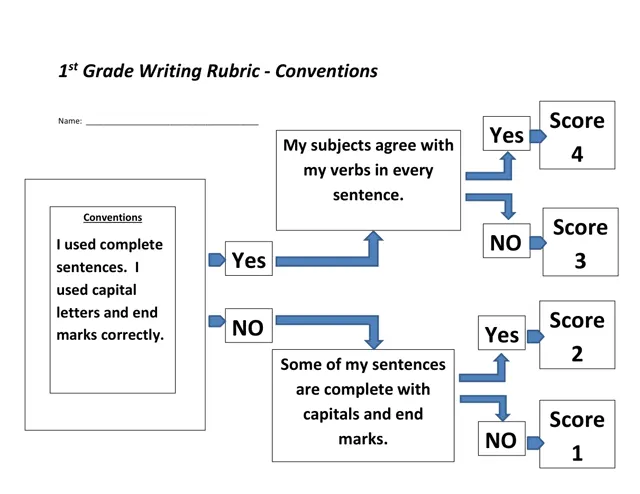
Grade 1 writing: conventions
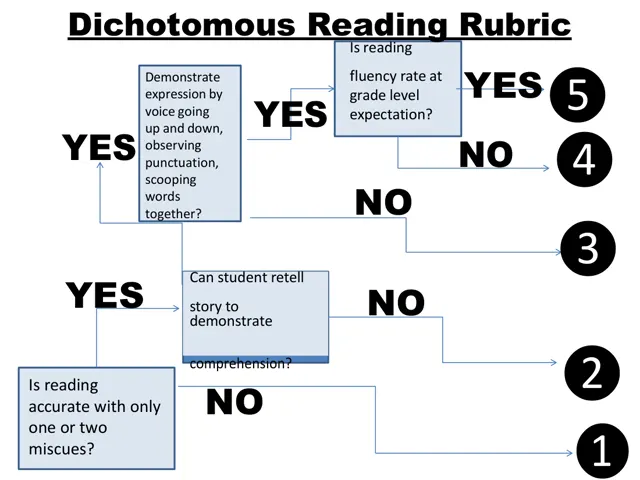
Reading
Expression, phrasing and accuracy when reading aloud.
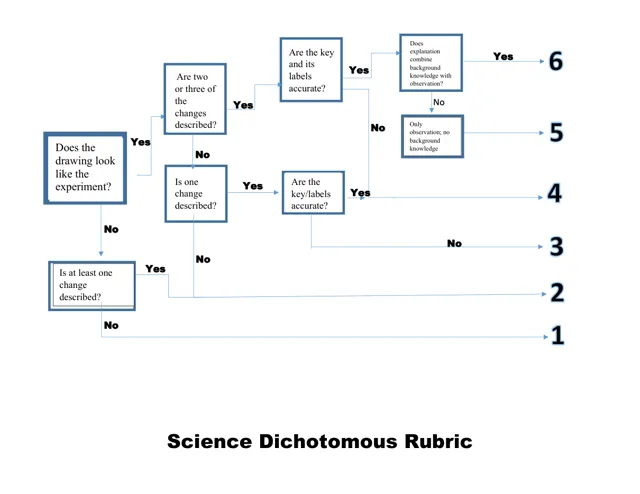
Science: the ink experiment
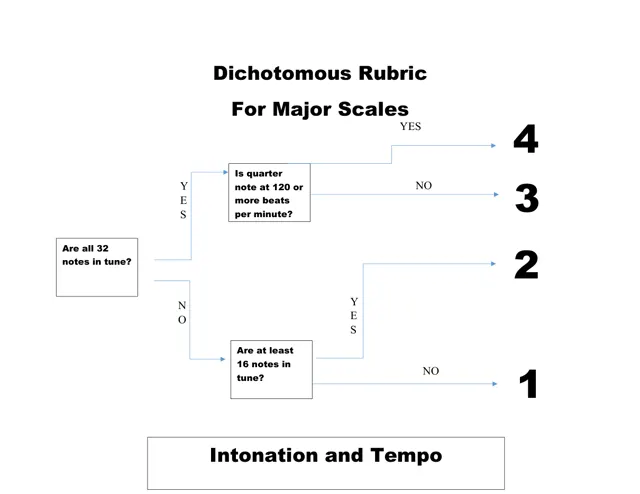
Orchestra: major scales
Accuracy and tempo, at 120 beats per minute or more.
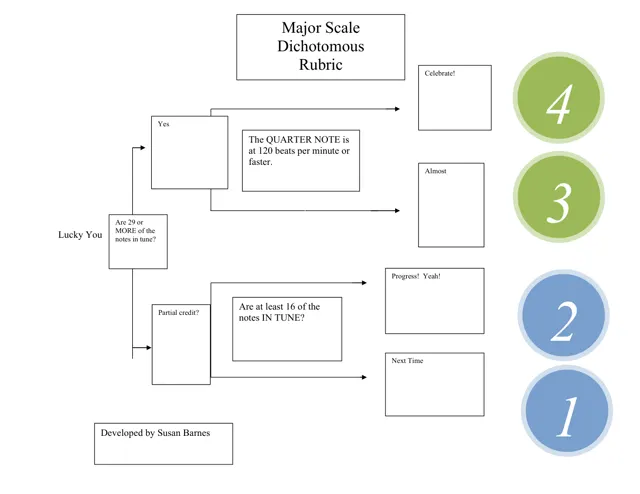
Music: scales
By Susan Barnes, Wilmer Amina Carter High School, Rialto, California.
Blank graphs
The graphs around this site are samples, filled in by real classes. These are blank, for your own students to fill in, and free for every teacher using Learning That Lasts. Three sets: key concepts, reading fluency and dichotomous rubrics. Choose a set, enter the size of your quizzes and your class, and download every graph you need at once.
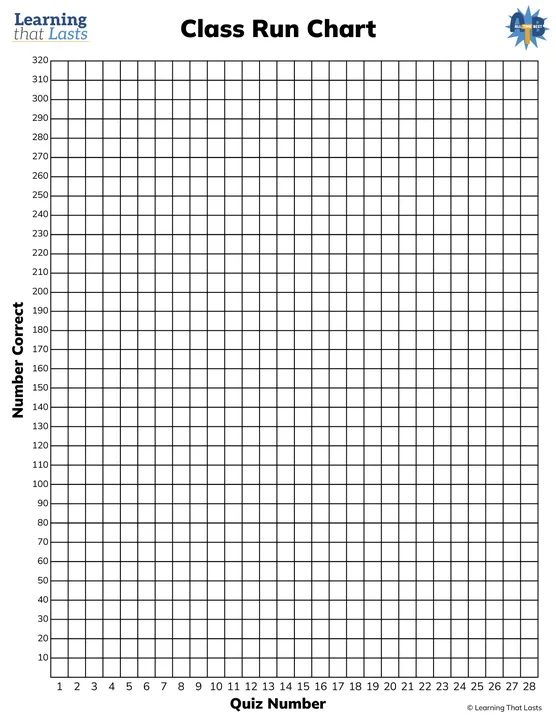
The number of questions on each quiz stays the same all year: a 16-question quiz every week means the 16-question graphs. The class run chart is sized by the highest score the class could make, questions times students.
16 questions320 at most
So the class run chart that goes up to 320.
Or download them one at a time below.
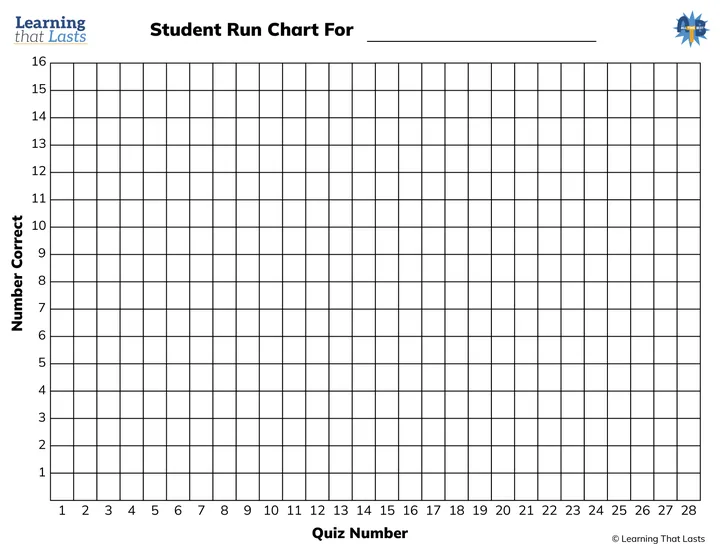
Student run chart
Each student’s own number correct, quiz by quiz. On one page, or on two: quizzes 1–14 and 15–28.
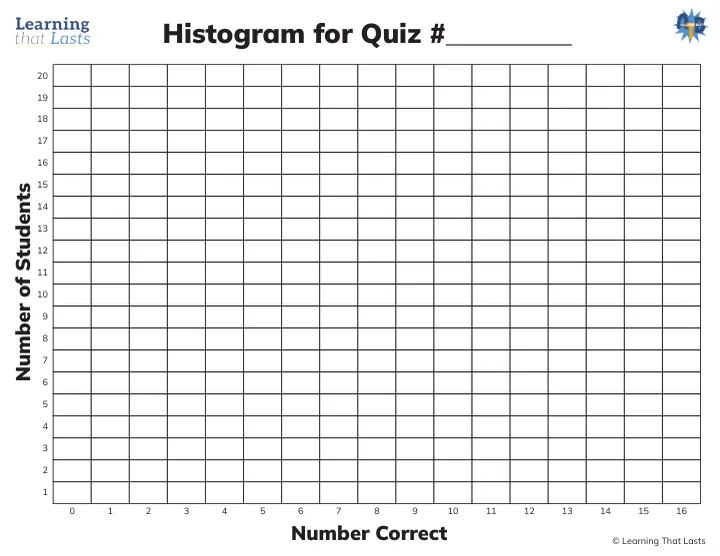
Histogram
How many students got each score on one quiz: an L in September, a J by June.
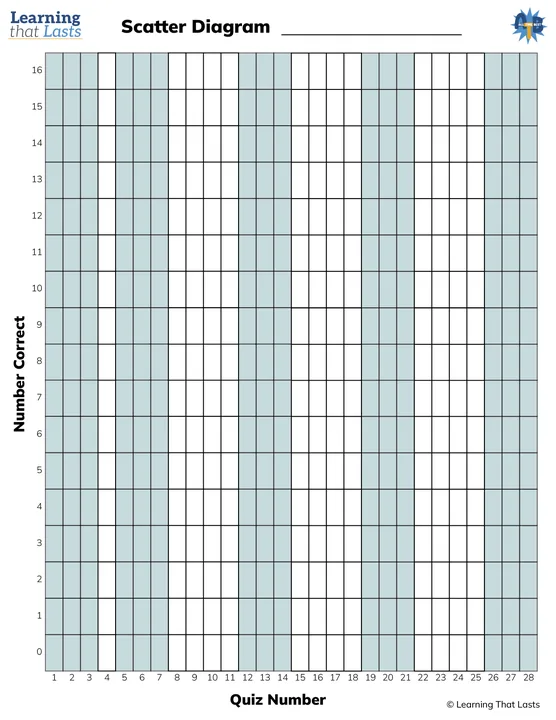
Scatter diagram
Every student’s score on every quiz, used each quarter to calculate the effect size.
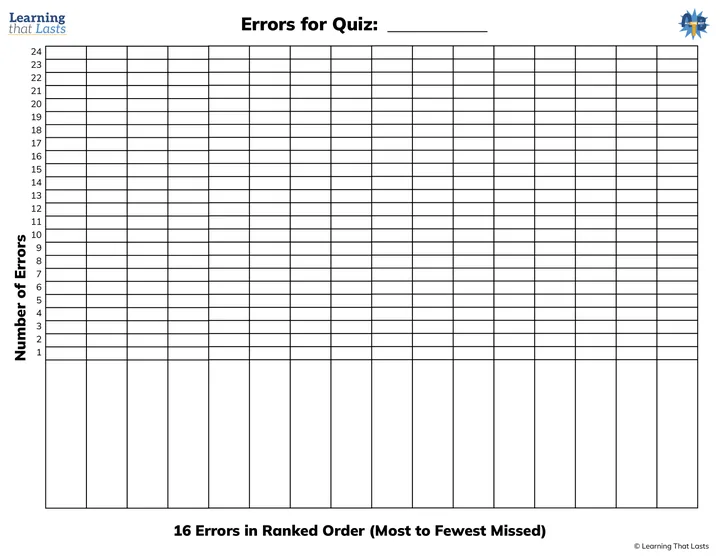
Item analysis
The questions missed on one quiz, from most missed to fewest.
Class run chart, up to 320
The whole class’s total correct, quiz by quiz, for the classroom wall.
Class run chart, percentage correct
For any class size: the class’s percentage correct, quiz by quiz.
Family run chart
The same run chart for home, by the highest number correct.
To see students celebrating both their own progress and the class’s, visit the Celebration Gallery.
How-to documents
Practical guides from real classrooms.
Celebrating All-Time Bests: a photo guide
Thirty-one photographs from Dr. Jenkins’ classroom visits, with his notes: graphs on closet doors, celebration walls, hand stamps, silly string and more.
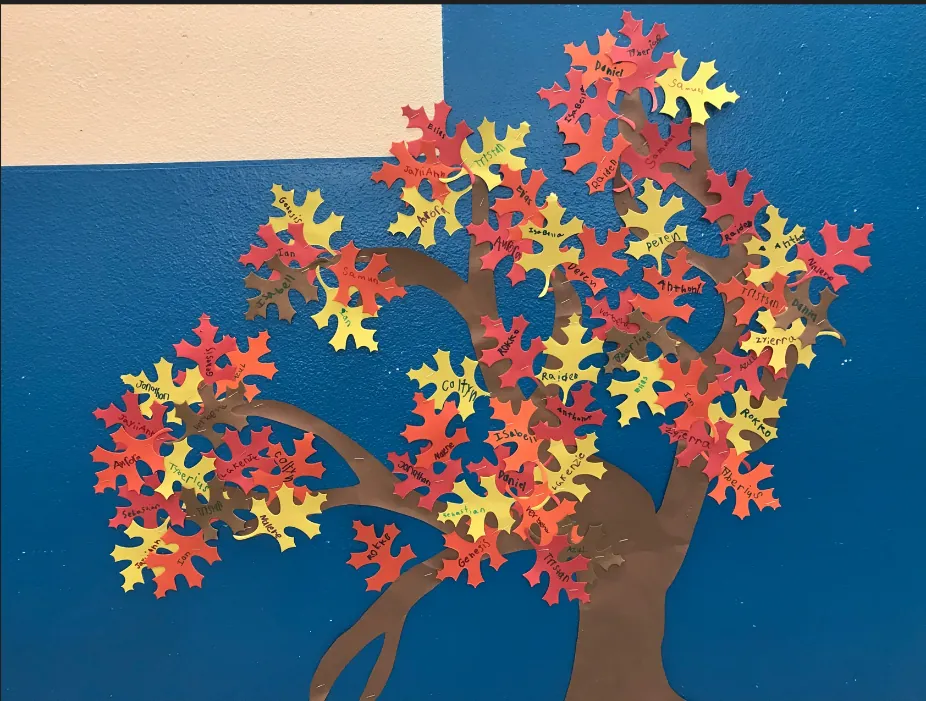
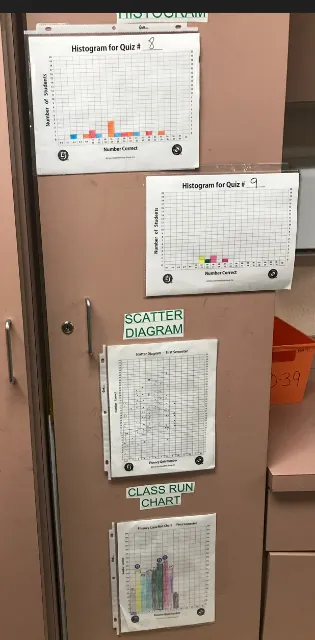
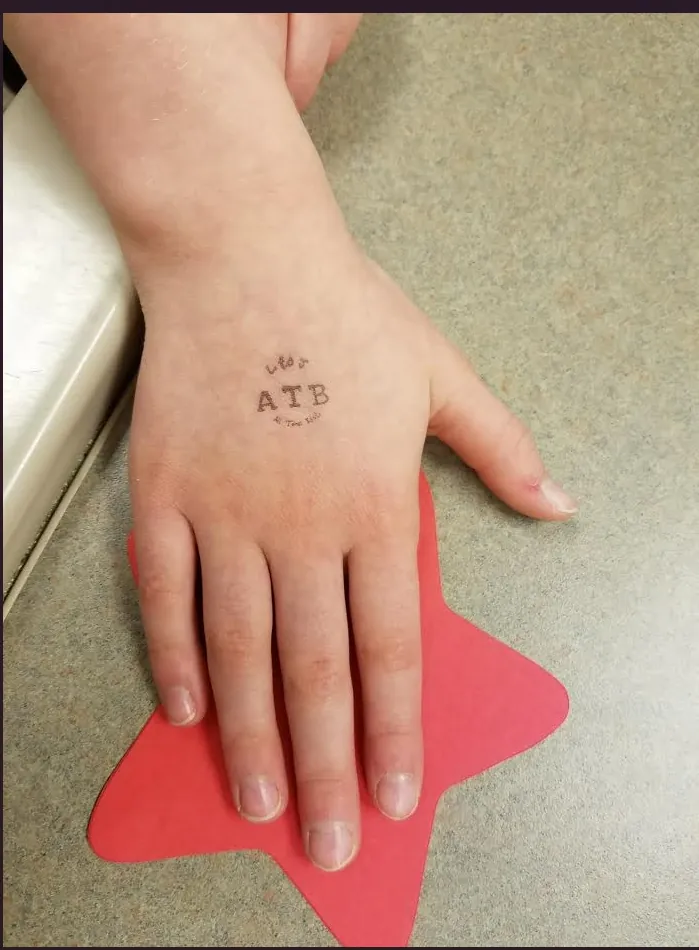
See the photographs on the wall of the Celebration Gallery.
Articles, blogs and videos
Dr. Jenkins’ published articles, his weekly journal, podcasts and talks.
Articles
- ArticleActual Intelligence
Education Today (Australia), 11 September 2026. Adult, adolescent and artificial intelligence: three ordinary materials that make a masterpiece together.
- ArticleIt’s Eerie — But We Can Predict the Future of Education
Education Today (Australia), 19 September 2025. The Jenkins Curve and W + R = M.
- ArticleEducation’s Trifecta
Education Today, 28 November 2025. Wonder, resilience and mastery, in that order.
- ArticleEducation’s Greatest Challenge
Education Today, 26 November 2021. Data for harm, the forgetting system and bribery, and what replaces them.
Podcasts and slides
- PodcastDr. Deming’s Advice to Educators: Crazy Simple Education (Part 1)
In Their Own Words, The Deming Institute. With slides: “The One-Minute Invite”.
- PodcastOptimizing Student Learning: Crazy Simple Education (Part 2)
In Their Own Words, The Deming Institute, December 2025.
- TalkSlides: The One-Minute Invite That Changed Everything
Shown during the first Deming Institute podcast.
- TalkSlides: Twenty Years of Teaching What Deming Taught
Shown during the second Deming Institute podcast: run charts, celebrations, histograms.
From the journal
- JournalDesign and Deliver
“No matter how skilled the teaching staff, a poorly designed education system will produce the same results year after year after year.”
- JournalWhat do restaurant servers and teachers have in common?
An anniversary dinner, a blamed waiter, and the hidden system behind both.
- JournalInspection and Learning
Students are inspected about 2,000 times between kindergarten and graduation.
Motivation
Learning That Lasts: From Tracks to Turf. The teacher is the quarterback, the principal the coach, the parents the fans, and the whole class crosses the goal line together.
From Tracks to Turf: the paper
With the student, class and school graphs.
Want your staff trained on this?
Dr. Jenkins’ workshops show teams how to write key concepts, build these quizzes and rubrics, and celebrate together.