Drag the floor or use ← → to visit other rooms
Averages compare schools. Evidence shows every learner.
An average hides every student. Graph every learner, every week, and the evidence shows who is ahead, who is on track and who needs a new strategy.
One average, or every learner.
The same class of 24, measured two ways. Move through the year and watch what the average hides.
51%
class average, one test day
Average: 51%. What it hides: 10 ahead of schedule, 0 finished the year’s learning, 3 needing a different strategy, and 11 right on track.
Students by how much of the year’s list they know, low to high. Early in the year most are piled at the low end (an L); by the end, at the high end (a J).
Comparing averages with true evidence
Today’s testing systems sample learning once a year and report an average. An average can hold steady while individual students race ahead, finish the year’s learning early, or quietly fall behind.
Learning That Lasts™ measures learning in every classroom, every course, every year: seven random-sample quizzes a quarter, graphed by the students themselves. Each quarter, two students enter the class’s scatter diagram into an effect size calculator, so the class knows how much it has grown.
| 311 | classrooms researched |
|---|---|
| 7,775 | students in the research |
| 217,700 | assessments tracked |
| 5.9× | the average influence on learning |
From Dr. Jenkins’ study of 311 classrooms. Beginning- and end-of-year data from each classroom gives an effect size; the average across classrooms was 2.35, which is 5.9 times the average of 250 other influences upon student learning (“Education’s Trifecta”, Education Today, 2025).
What an effect size of 2.35 looks like
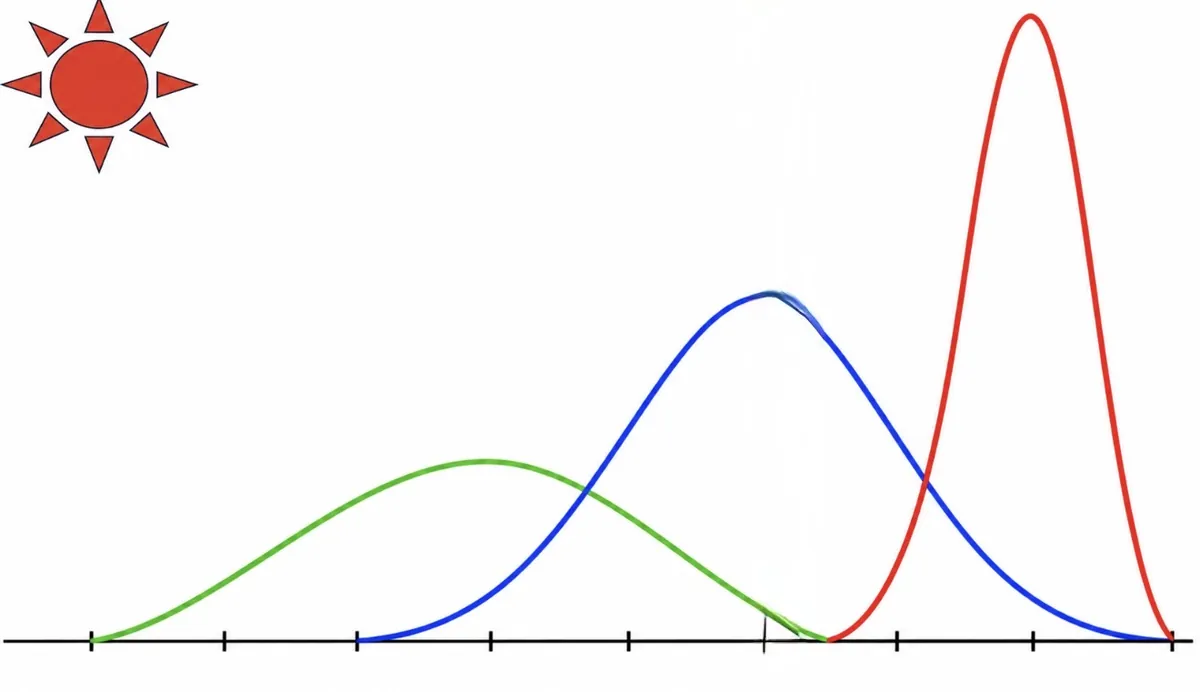
Picture a class as a curve: where its students’ scores sit, from low to high. An effect size is how far the whole curve moves over the year, measured in the spread of those scores. Here are two, each moved to scale.
0.40
The average influence on learning
Hattie’s average across 250 influences, for a year. The end-of-year class still overlaps most of where it began.
2.35
Learning That Lasts classrooms
The average across 311 classrooms in Dr. Jenkins’ study. By June the class has moved almost clear of where it was in September, and bunched together near the top.
From the keynote
Dr. Jenkins on the number this hall is built on.
The number behind the Evidence Hall: what an effect size measures.
≈2,000
33%
Sources: “Inspection and Learning”, learningthatlasts.com, 2026; and Dr. Jenkins’ survey of 3,000 teachers, “Education’s Greatest Challenge”, Education Today, 2021.
It is a crazy system that evaluates students on short-term memory yet evaluates educators on the students’ long-term memory!
 Dr. Lee Jenkins“Education’s Greatest Challenge”, Education Today, 2021
Because any concept can appear on any quiz, there is nothing to cram and forget. Earlier grades’ learning keeps coming back too, which is how schools win back the weeks once spent on review.
How a class measures its own learning
To lead learning, teachers and administrators need to know how it is going all along the way. State assessments arrive after students have finished the course, and record data for fewer than half of classrooms. We can do far better.
Effect size, not averages
Dr. John Hattie, author of Visible Learning, made the effect size known to educators. State tests calculate an average and rank it. An effect size uses the average and the spread of scores together.
The hardest part of leading learning is moving every student forward without leaving the ones who struggle behind. A high effect size means both happened.

With John Hattie, whose effect size research this hall measures against, at Corwin’s Visible Learning conference, 2018. The histogram moves toward a J
Students draw the class histogram themselves. Quiz by quiz, it moves from an L at the start of the year toward a J, the actual learning of a whole classroom.
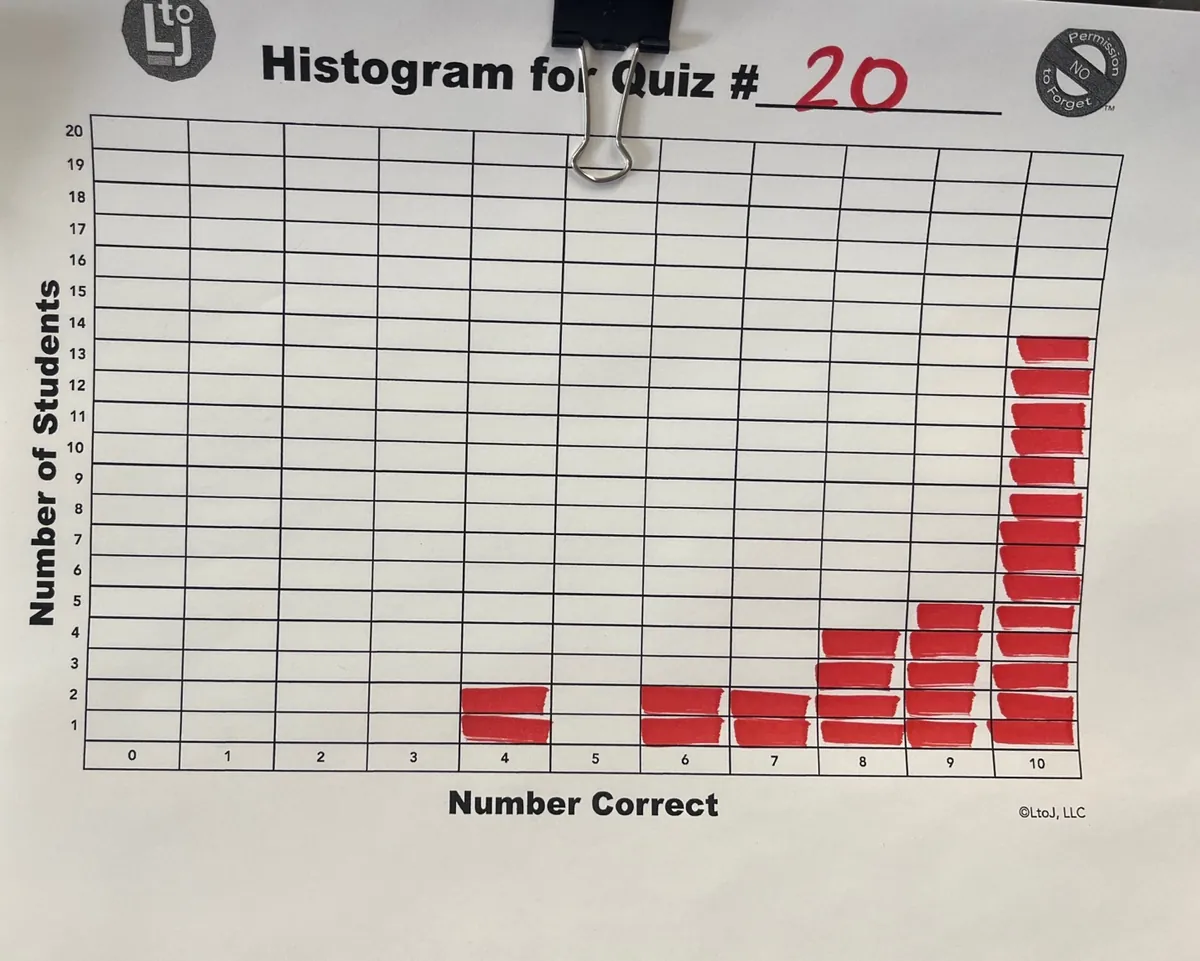
The class histogram, made by students, moving toward a J: the learning of the whole class, quiz by quiz. Every student, every quiz
The scatter diagram records every student’s score on all 28 quizzes of the year, anonymously. In this first-grade class learning its 100 sight words, the words were written on tongue depressors and kept in a can. Almost every week ten were drawn at random: “Find the words you can read and read them to me.”
On the first quiz, six students read none of the words, and one read all ten. Halfway through the year, seven read all ten. One read five, and in a ranked classroom that child would be the one with a “reading problem.” In fact, reading half the words halfway through the year, the child is right on track.
This class’s effect size for half a year was 1.93: almost five times the average influence on learning for a whole year.
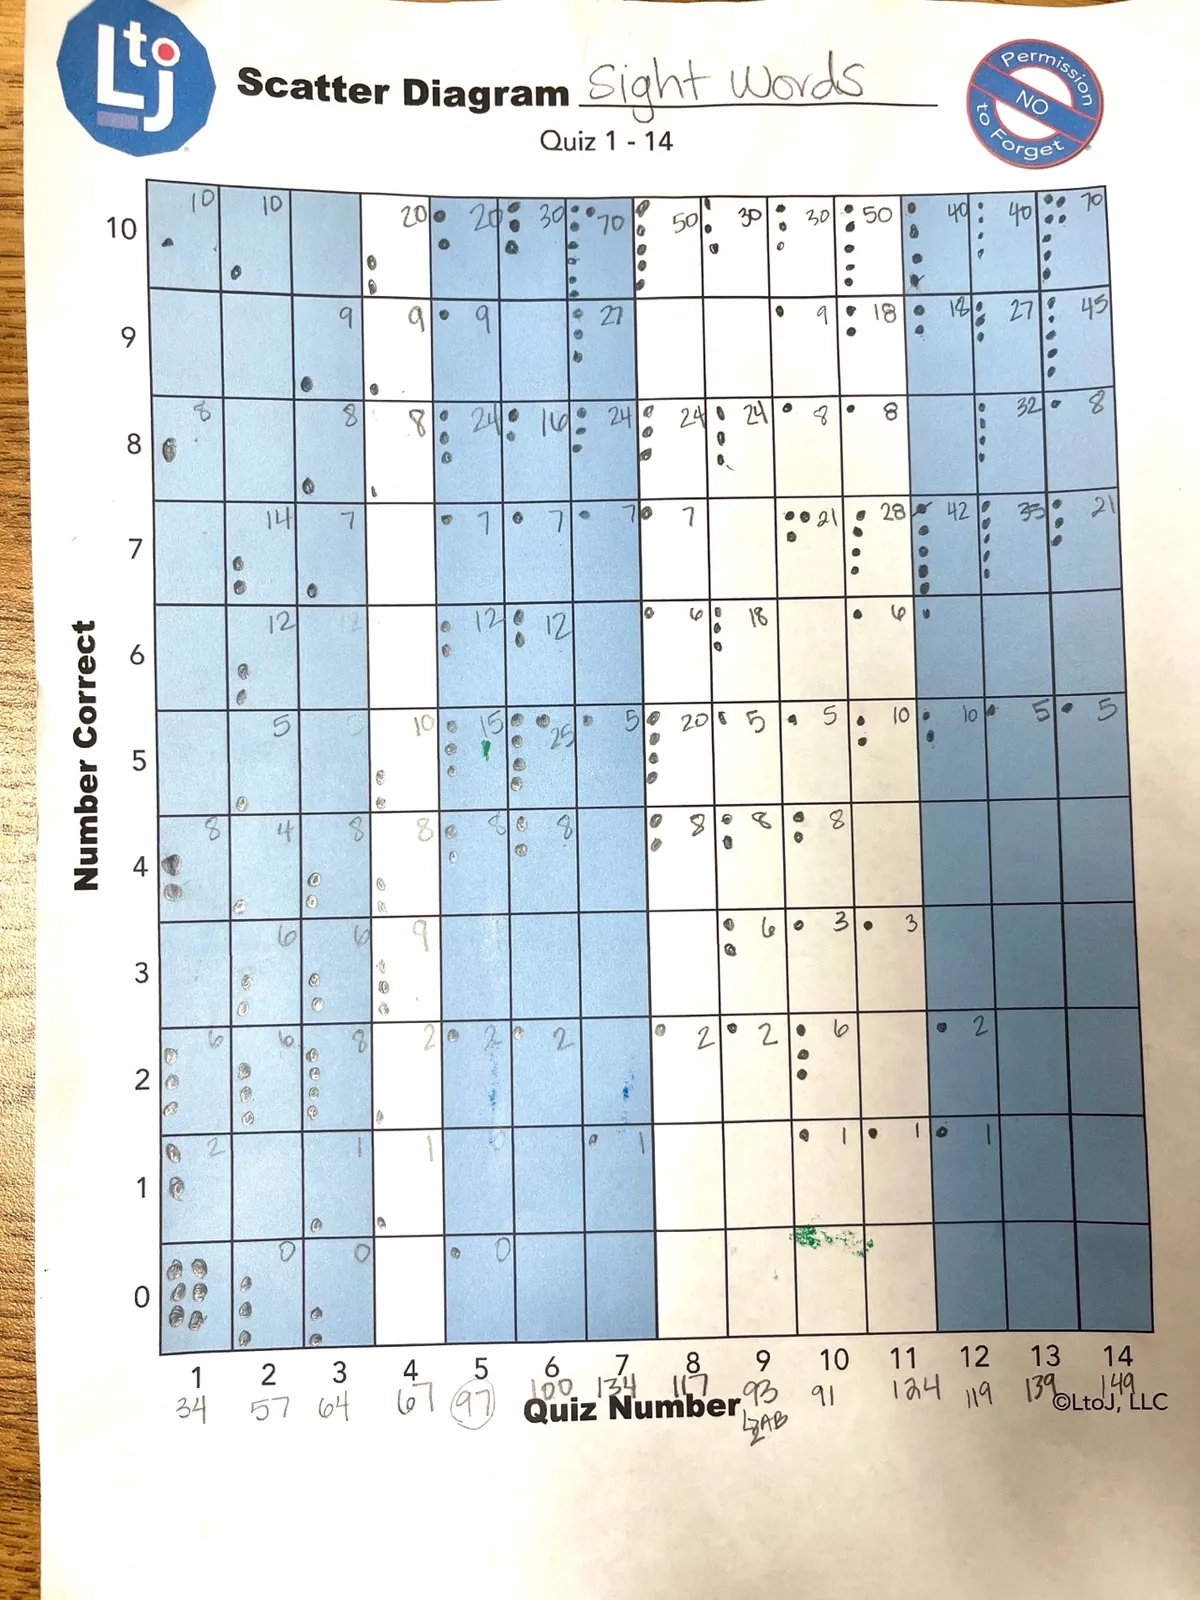
A first-grade sight-word scatter diagram for the first semester: one dot for every student on every quiz. Students calculate it themselves
Each quarter, one student reads the numbers off the scatter diagram while another enters them into the Learning That Lasts effect size calculator. To be more dependable, the first three quizzes of the year are compared with three later quizzes, rather than one quiz with one.
It is not unusual for a class to reach an effect size of 0.40, the average for a whole year, by the end of the first quarter. Probably the main reason: every student is striving for a personal All-Time Best, while with grades, most students don’t care.
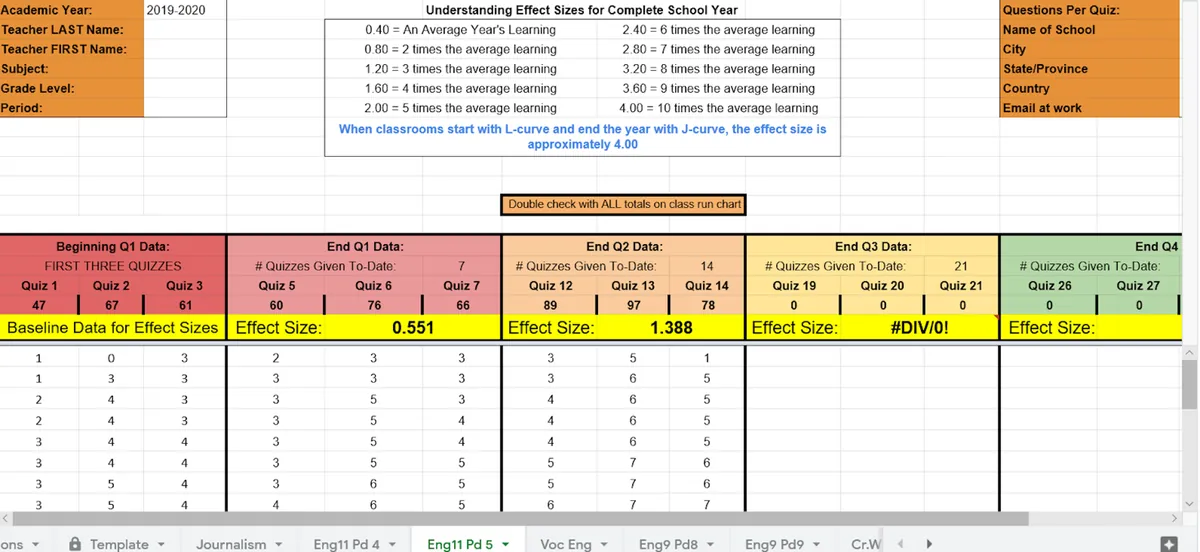
The Learning That Lasts effect size calculator, built for the 28 quizzes of a year. Students enter the numbers themselves.
When the students and teachers learn that their learning is 3-6 times the average they are very impressed with themselves.
 Julie OteroNebraska Department of Education; formerly Superintendent, Centura School District, Cairo, Nebraska
A deep look into decades old education problems such as cram/forget, data used to discourage, and change without any evidence of improvement. THEN he provides solutions that are simple and profound.
Jim Hawkins, Ph.D.Assistant Professor, Educational Leadership, Cameron University, Lawton, Oklahoma
Measure real learning in every classroom, every week.
We are both amazed at how many questions students are answering correctly on the comprehensive exam for content that has not yet been taught.
 Laura HayesPrincipal, Massac Junior High School, Metropolis, Illinois