Drag the floor or use ← → to visit other rooms
Assessment should be a checkpoint, not a choke point.
Students graph their own quiz scores every week, so progress is visible to them, their class, their parents and their principal.
Every quiz, graphed by the student.
Pick a learner, then play the year or drag across the graph. Each bar is one quiz; the report card reads what the bars add up to.
42%of the year’s learning, shown so far
- On track to meet the year’s expectations? Yes
- Speeding ahead of schedule?
- Finished the year’s learning?
- A different strategy working?
Seven quizzes a quarter. Seven perfect quizzes in a row, and a student moves on to the next level or to a major interest of their own.
After every quiz, three small jobs for each student
Graph my number correct
On a blank student run chart: the quiz number along the bottom, the number correct up the side.
Highlight what I got right
On my own key concept list, so I can see how much of the year’s map I already know.
Add my score to the class total
Anonymously. The class run chart on the wall shows the whole room’s total correct, quiz by quiz.
Quiz day in a Spanish classroom
Liliana Velasco teaches Spanish at Columbus High School in Nebraska. On quiz days, she says, her students are “so relaxed; there is no stress or worry.” This is how the period runs.
Take the quiz
A few questions drawn from the whole year. It isn’t graded.
Swap papers
Students exchange quizzes and score each other’s.
Correct every miss
Each wrong answer is marked, and the right answer written in beside it.
Add up the class
The total correct for the whole class goes on the class run chart.
Call the inspector
A student inspector checks that every miss carries its correct answer.
Celebrate
If the total beats every quiz before it: an All-Time Best.
The teamwork with LtoJ® [prior name for Learning That Lasts] is so very powerful—no other practice in education causes every classroom to function as a team. We all come together; everyone counts!
From the keynote
Random quizzes, run charts and histograms, in Dr. Jenkins’ own words.
With the list in hand, every student ends the year on target, speeding, completed, or on a new strategy. Why each week’s questions are drawn at random from the whole year, so there is nothing to cram and nothing to forget. How classrooms draw their quiz numbers: numbered slips in a hamster ball, or one roll of a 100-sided die. A class histogram sorted into on target, speeding, completed and different strategy, and what it says about seat time. A student’s run chart for the six traits of writing: one rubric score per trait, quiz after quiz. A class’s total correct, quiz by quiz, drawn by the students themselves. The method in a high school finance class, quiz by quiz.
The graphs on the wall belong to the whole class
Class run chart
Total correct for the whole class. When it beats every quiz before it, that’s an All-Time Best, and everyone celebrates.
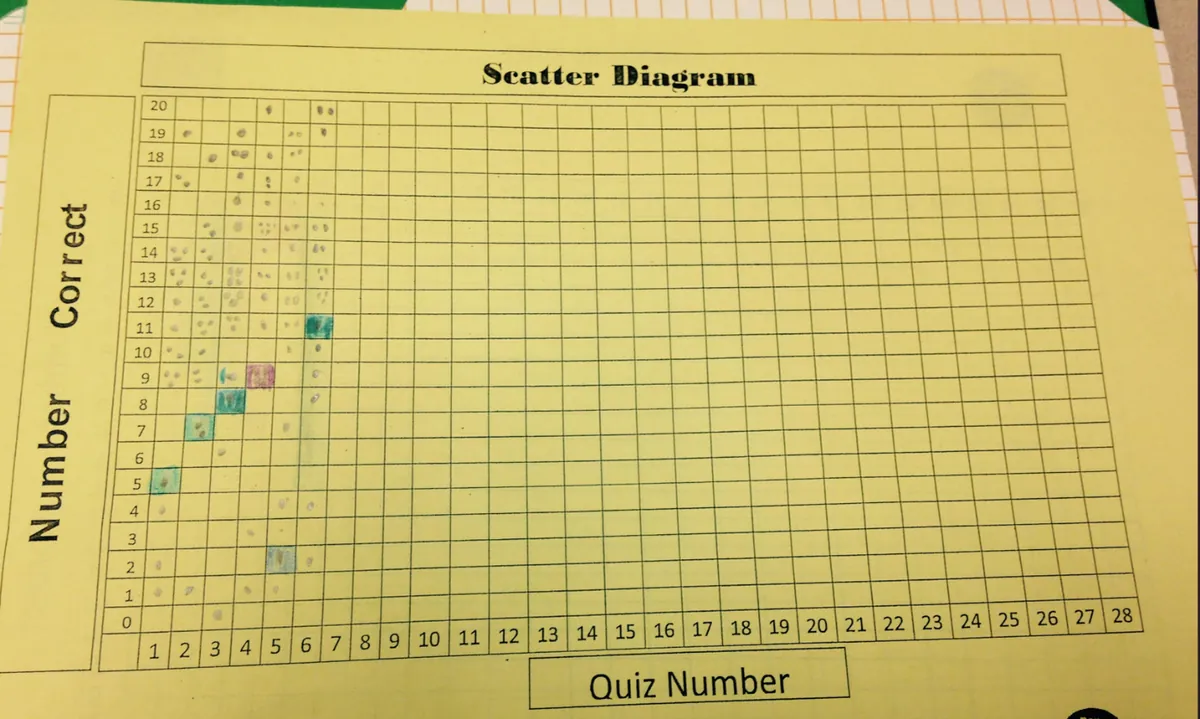
Scatter diagram
Every student’s score on every quiz, used each quarter to calculate the class’s effect size.
Histogram
Most of the class at the low end in September (an “L”), a bell by midyear, piled at the high end by June (a “J”). Learning That Lasts was first named LtoJ® for that shape.
Two students are assigned to keep each wall graph when they’ve finished their class work, so no teaching time is spent on them. In many schools, older students gather every classroom’s total for a school run chart by the office.
Business as usual
When local TV crews and several administrators came to observe in one of our classrooms, it was ‘business as usual’ for the students. They seemed almost unaware of the cameras; they were going about their data collecting and graphing as if it was a normal day, focused on calculating the statistics on effect size, as a way to “measure” their learning, and celebrating together.
Graphs in real classrooms
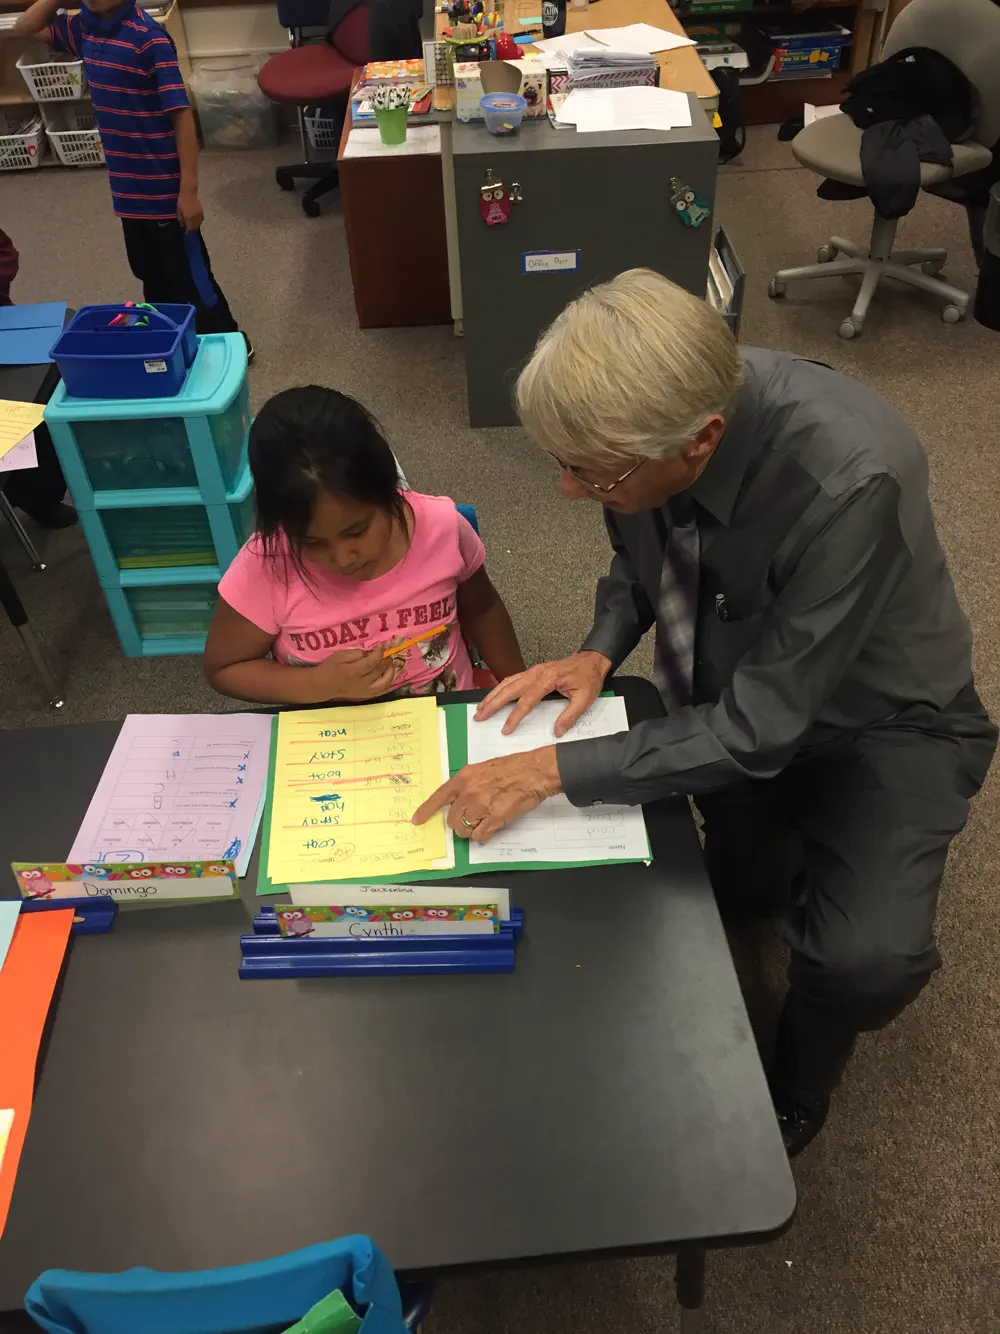
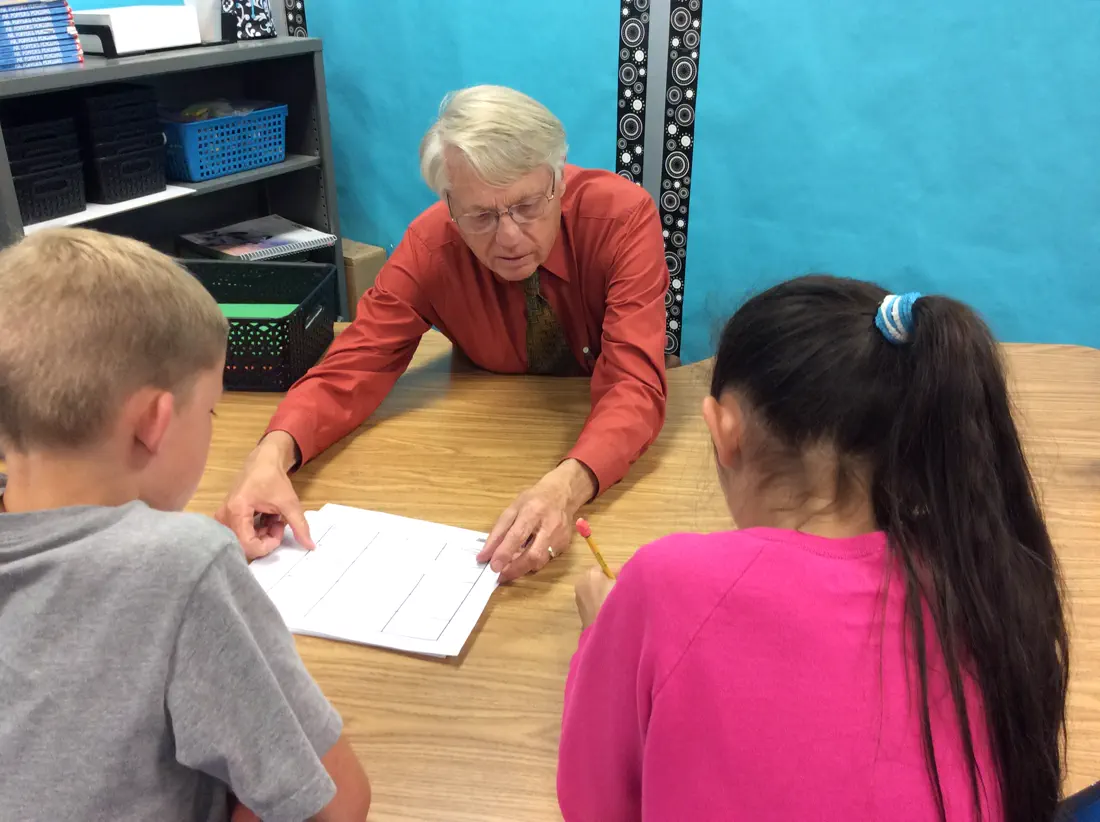
- Going over a spelling quiz with a student, word by word.
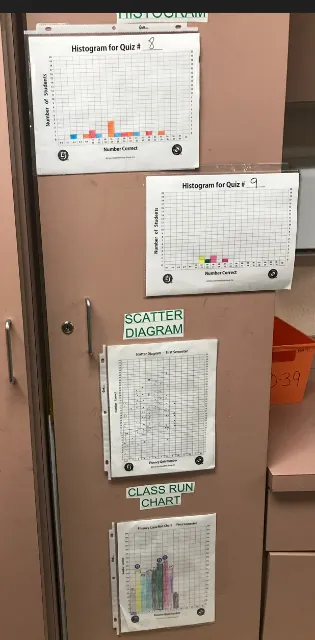
- The three classroom graphs on a closet door, in sheet protectors so students can update them after each quiz. Two students keep each graph, rotating through the year.
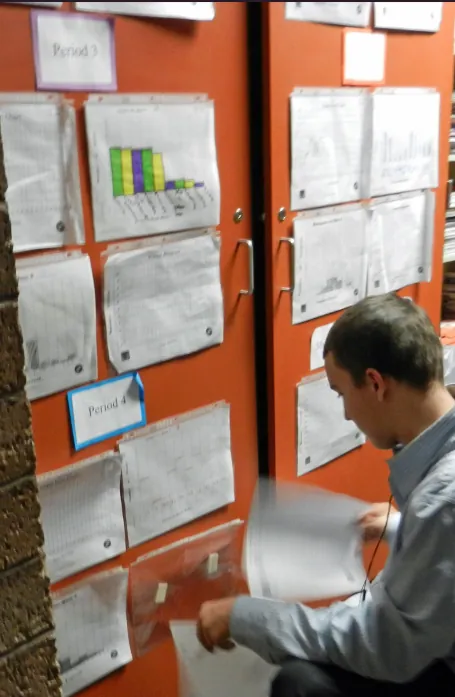
- A high school student updating graphs for his class: one closet door for each period of English.
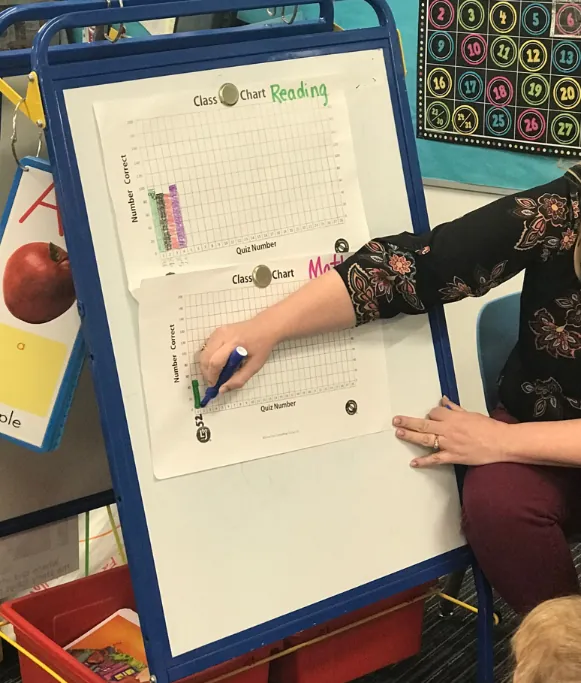
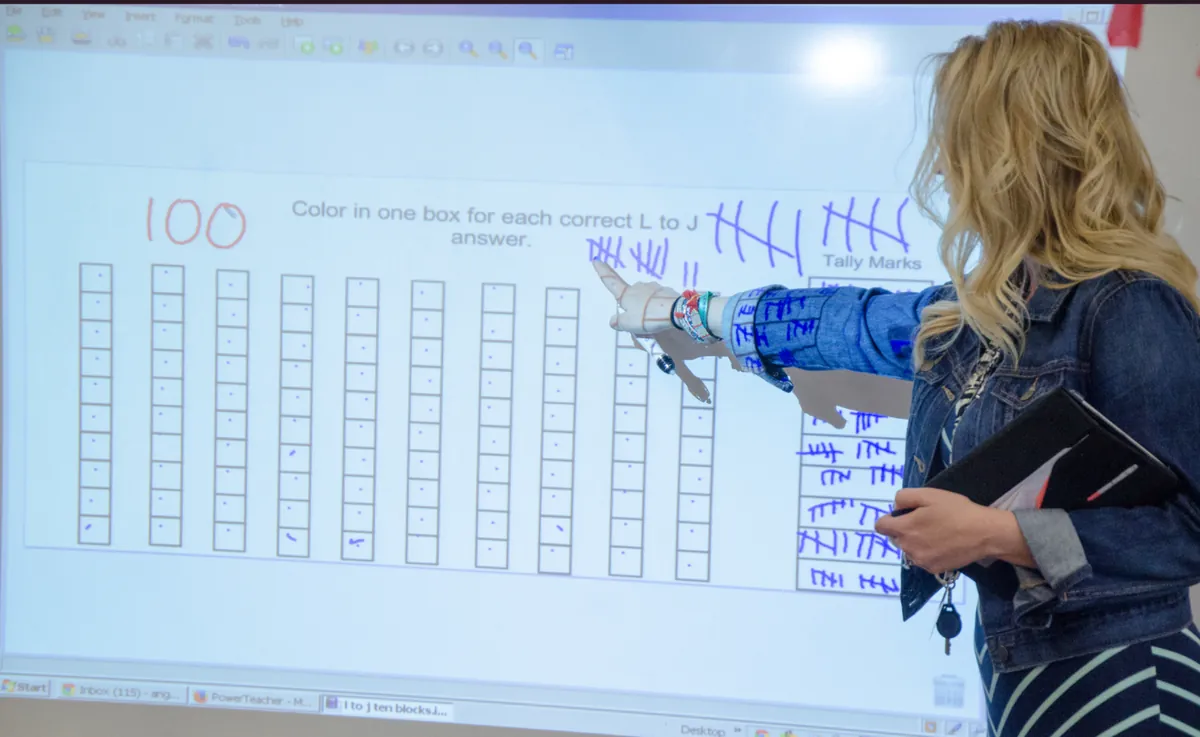
- With one class run chart for reading and one for math, a kindergarten teacher explains that the run chart is the total correct for all students together.
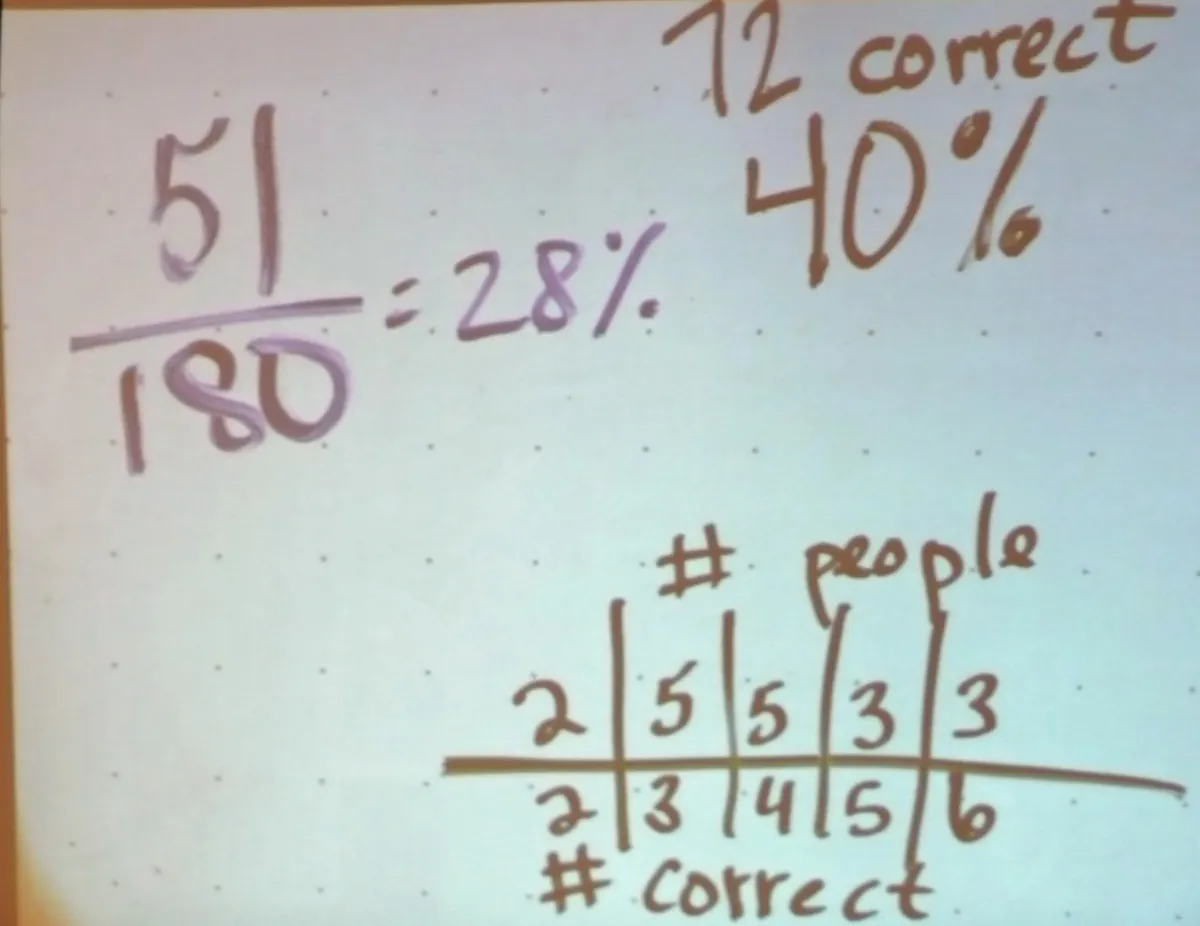
- The class worked out they had used 28% of the days of the school year, but had 40% correct on the latest quiz. Speeding!
- Setting up a chart with two students.
- Students put dots on the whiteboard for their number of correct answers, so the class could count the total together.
- A copy of the scatter diagram with one student’s scores highlighted answers the IEP question “How is my child doing compared to the rest of the class?” far better than words.
A speedometer or an odometer?
A speedometer shows how fast you are moving at one moment. An odometer records how far you have traveled. Chapter tests are speedometers: they reward students who learn the content by the first deadline, and a student who needs more time can carry a low grade long after they understand it.
Learning That Lasts measures the knowledge students keep as the year goes on. Every week, questions are drawn at random from the whole year’s key concepts, including concepts not yet taught. The quizzes are scored but not graded. Nobody is expected to know the whole year in September; the quizzes show how much of the destination each student has reached.
- 25%by the end of the first quarter
- 50%by the semester
- 75%by the end of the third quarter
- Allor almost all, by the end of the year
Is my child on track, accelerating, finished, or following a different strategy?
| Reading | On track |
|---|---|
| Mathematics | Speeding |
| Science | Completed |
| Spanish | Trying a different strategy |
Odometer Report Cards™
Traditional A–F grades say little about where a child is headed. Learning That Lasts™ Odometers answer the questions parents actually ask: whether their child is on track to meet the year’s expectations, speeding ahead of schedule, has already completed the year’s learning, or is succeeding with a different learning strategy.
Students can answer those questions themselves. Every student can point to their graphs and tell their parents where they are on the year’s journey.
- On track
- Your child is on track to meet the year’s learning expectations. This quarter’s expectations are met.
- Speeding
- Your child is progressing ahead of the expected pace.
- Completed
- Your child has shown mastery of the year’s expectations early. Acceleration or enrichment is the next step.
- Trying a different strategy
- We are trying a new learning strategy, and your child understands the plan.
Who reads the graphs
Parents and IEP teams
“Parents see the evidence of learning. Also, when we have IEP’s, the graphs play a very important part in our deliberations.”
Chris CreliaPrincipal, Wilson Elementary School, Norman, Oklahoma
Students
“I love how it changes their mindset from how many I got wrong to, I know more than I have ever known before!”
Diane BeninatoPrincipal, Linden Elementary School, Fremont, Nebraska
The whole class
“Our growth with scales is visible on the class run chart. All students see continuous improvement.”
 Susan BarnesOrchestra and vocal music, Wilmer Amina Carter High School, Rialto, California
Make course credit mean lasting learning
Worry about students using AI to complete assignments points to an old problem: students can earn course credit without learning. AI only makes it more visible.
A diploma should stand for knowledge and skills students can still use. With Learning That Lasts, competency means learning that remains long after the coursework is over.
Assessment your students look forward to.
As an administrator I just love going into classrooms and studying the learning as displayed on the classroom graphs. The kids can explain all the charts to me. They “get it.”
 Julie OteroNebraska Department of Education; formerly Superintendent, Centura School District, Cairo, Nebraska